King's College London
We worked with King's College London to visualise the output from their "Impact Tracer" text analysis tool.
- Client: King's College London
- Links:
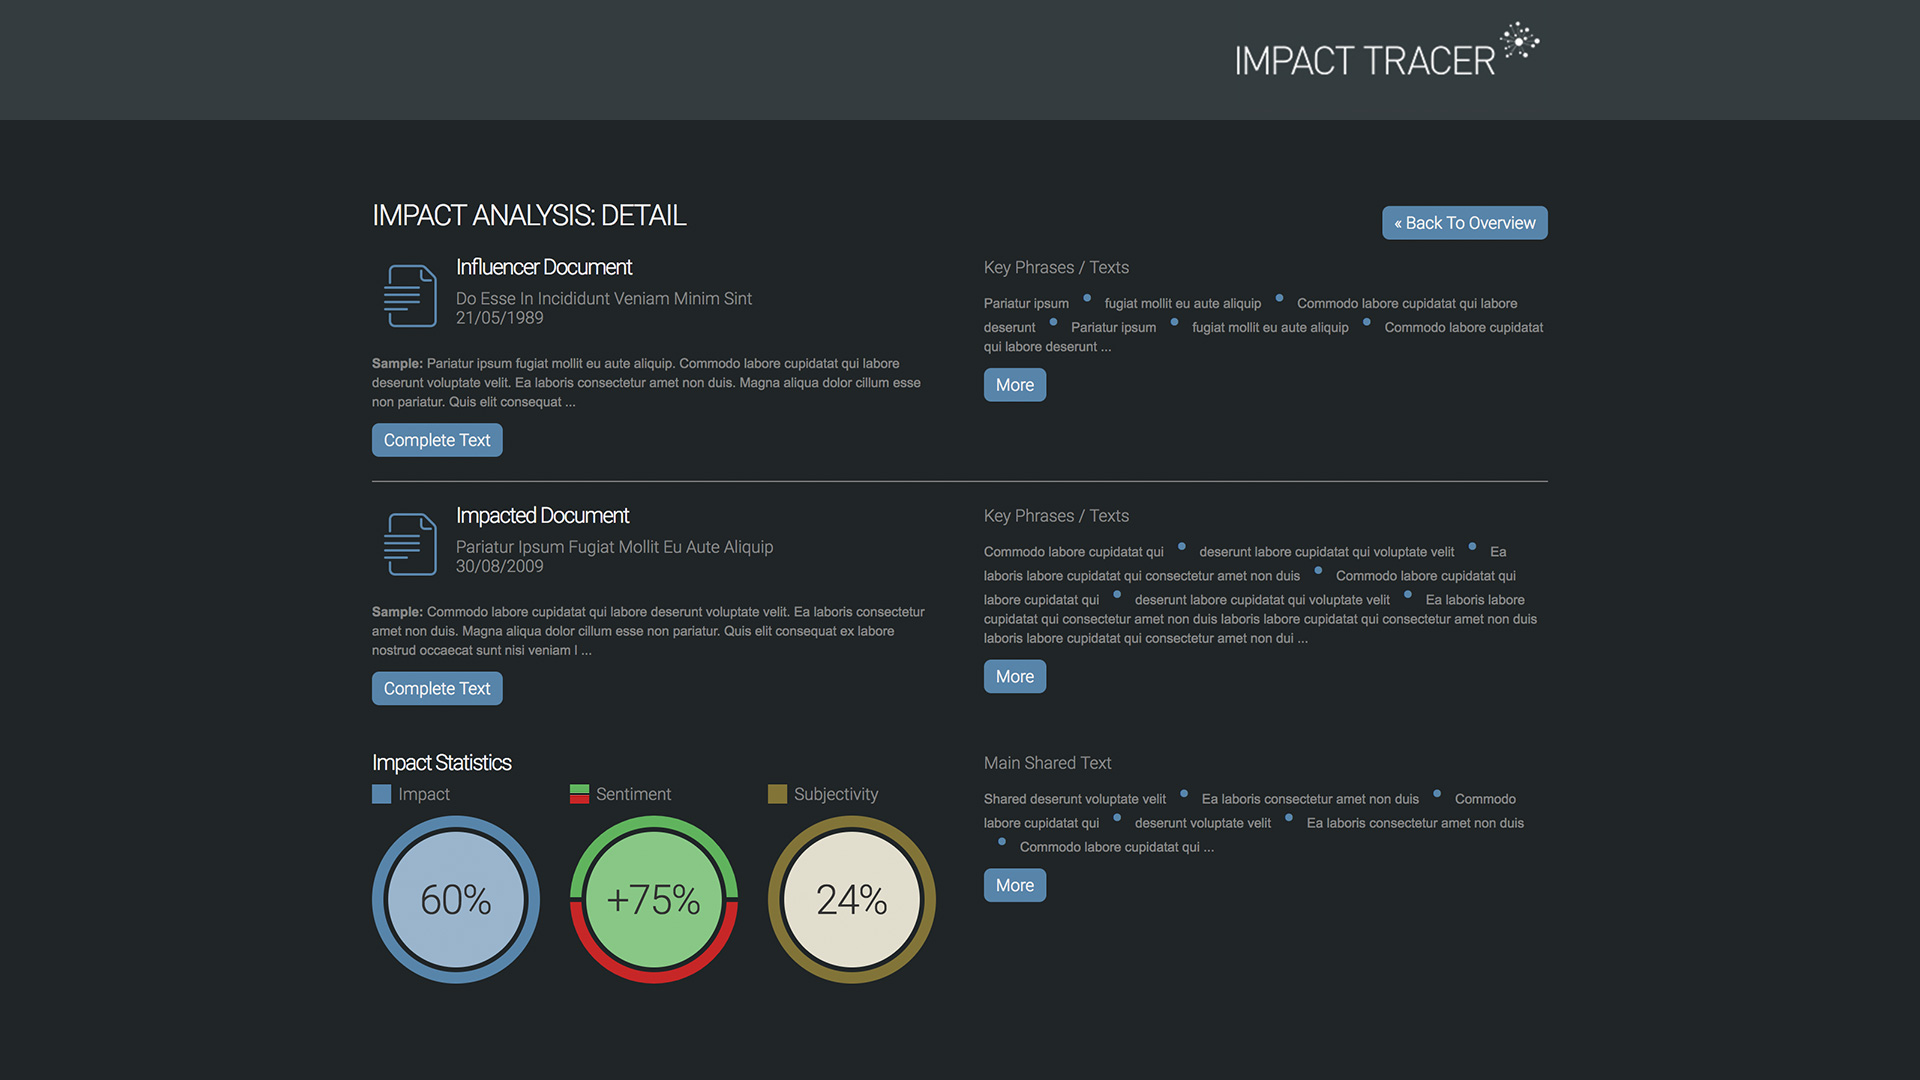
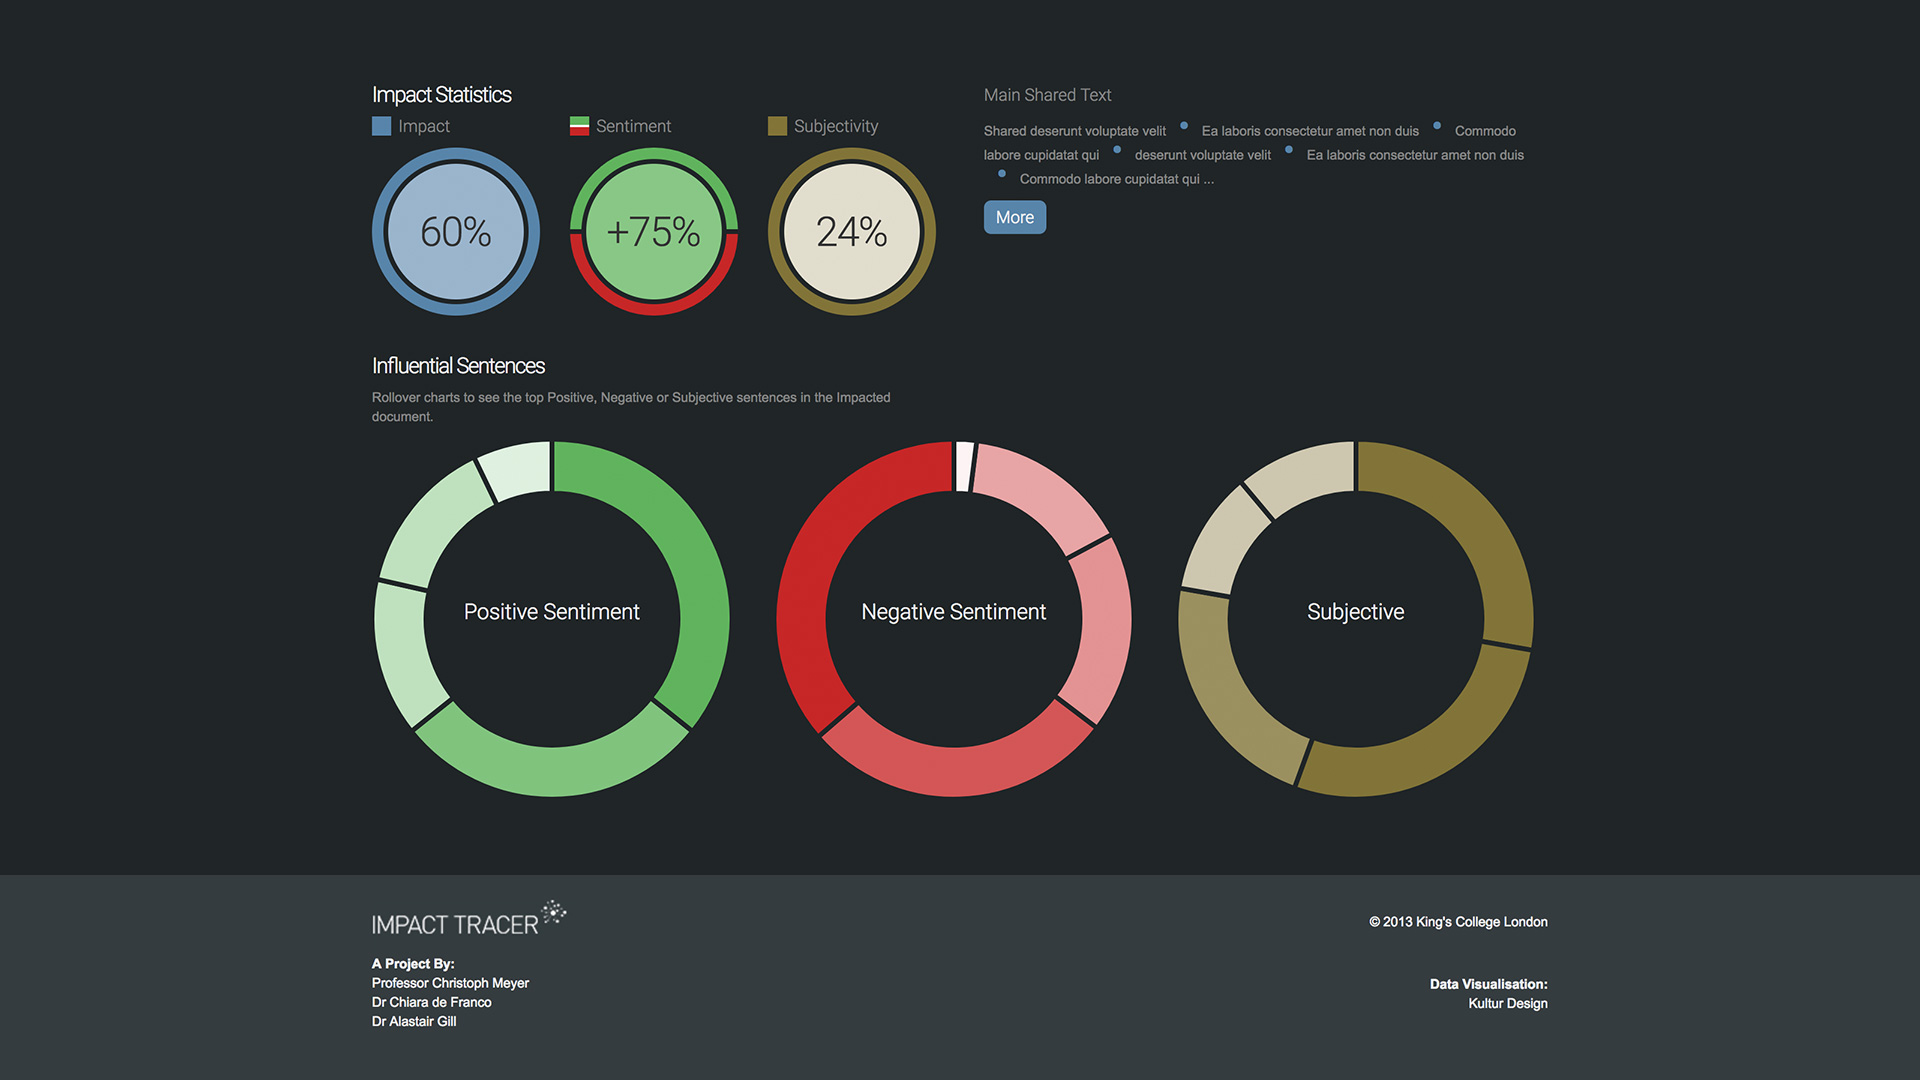
King's College London had created a tool, "Impact Tracer", to help measure how certain texts (speeches, articles & academic papers etc) had impacted subsequent texts on similar subjects.
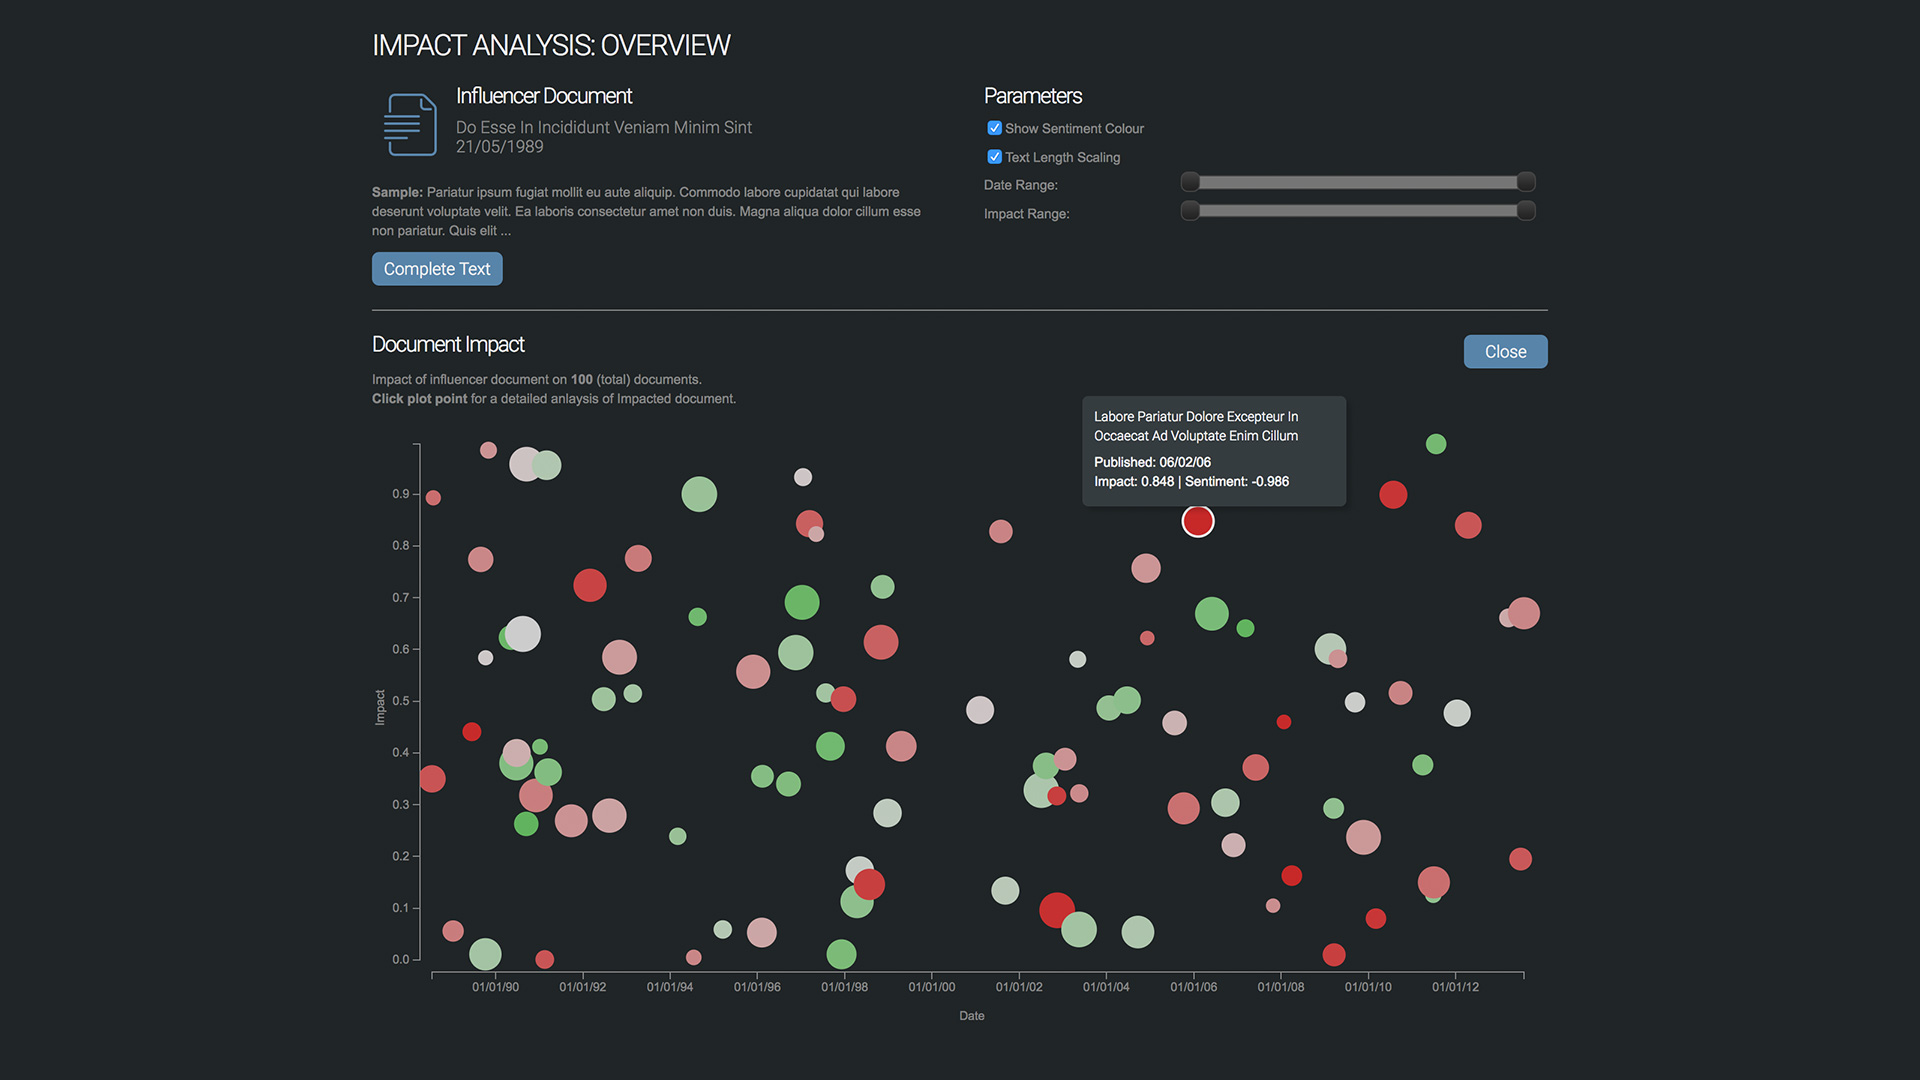
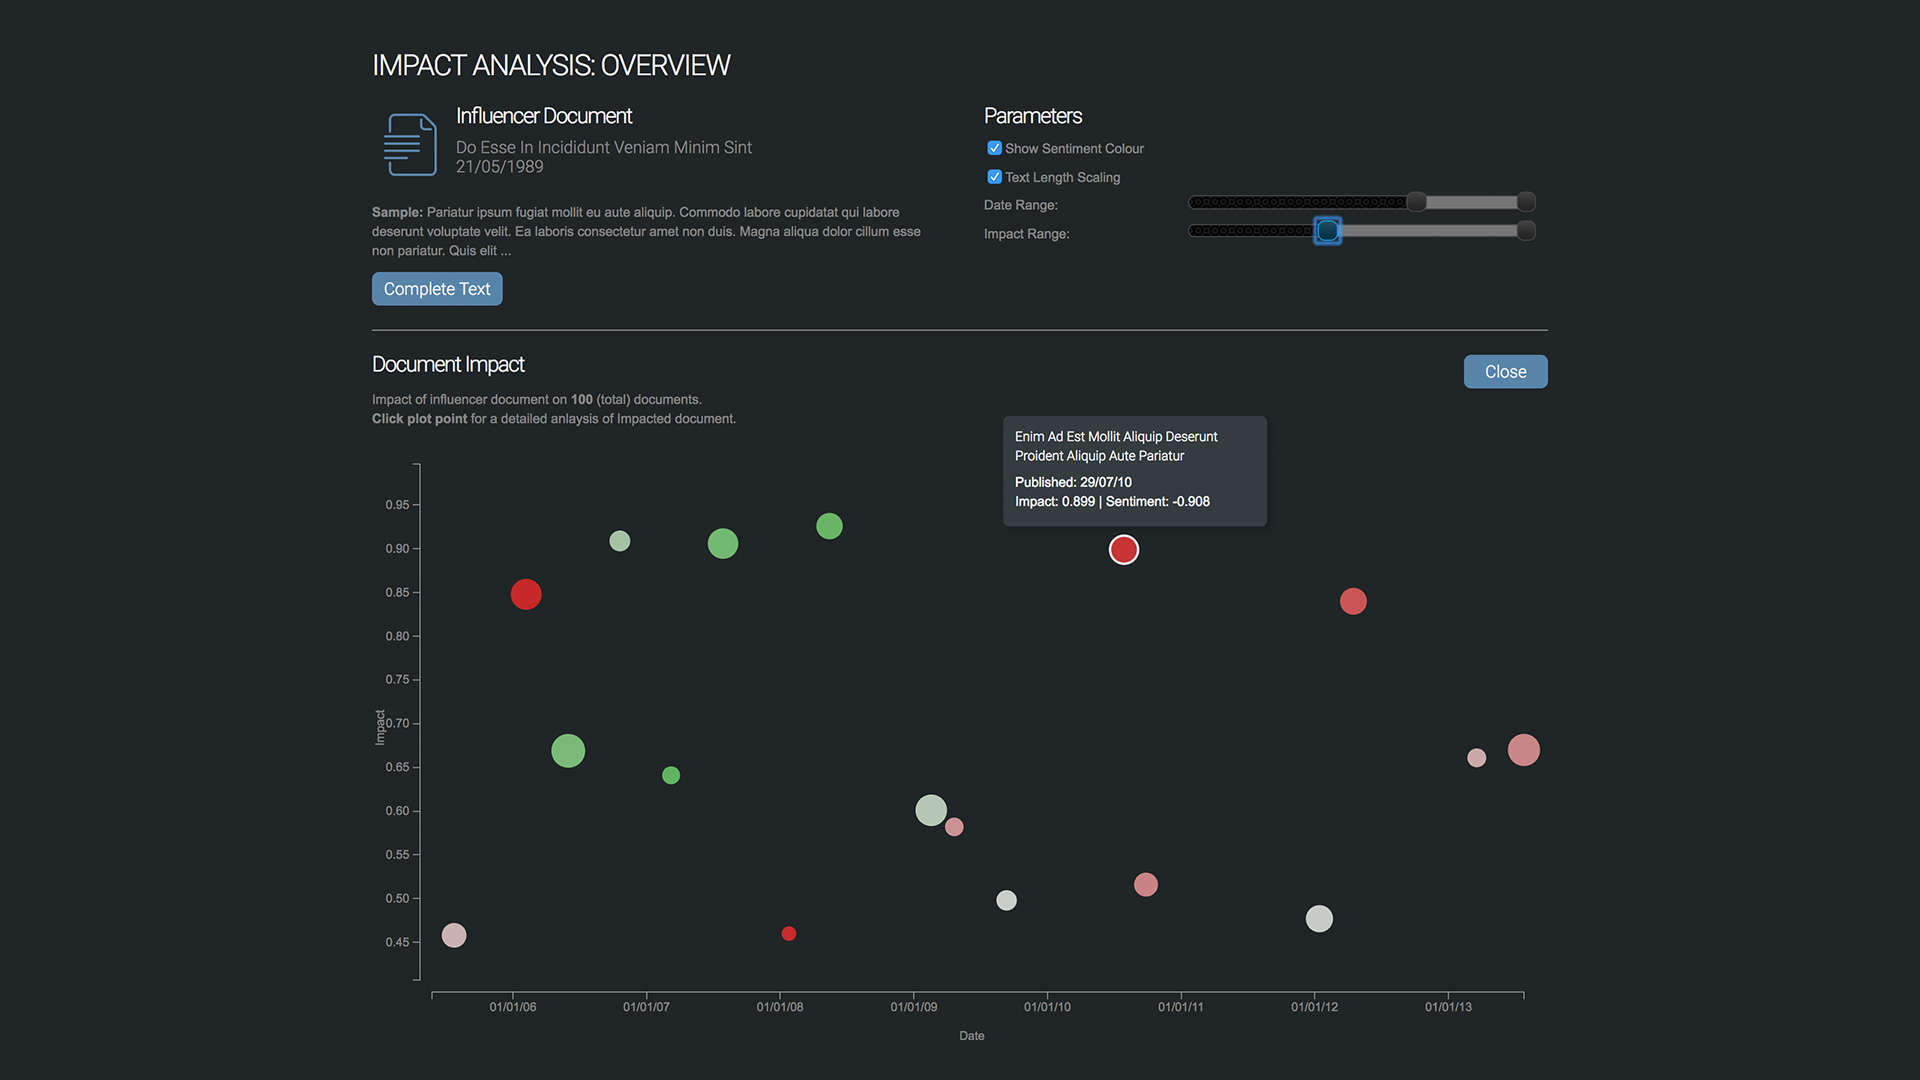
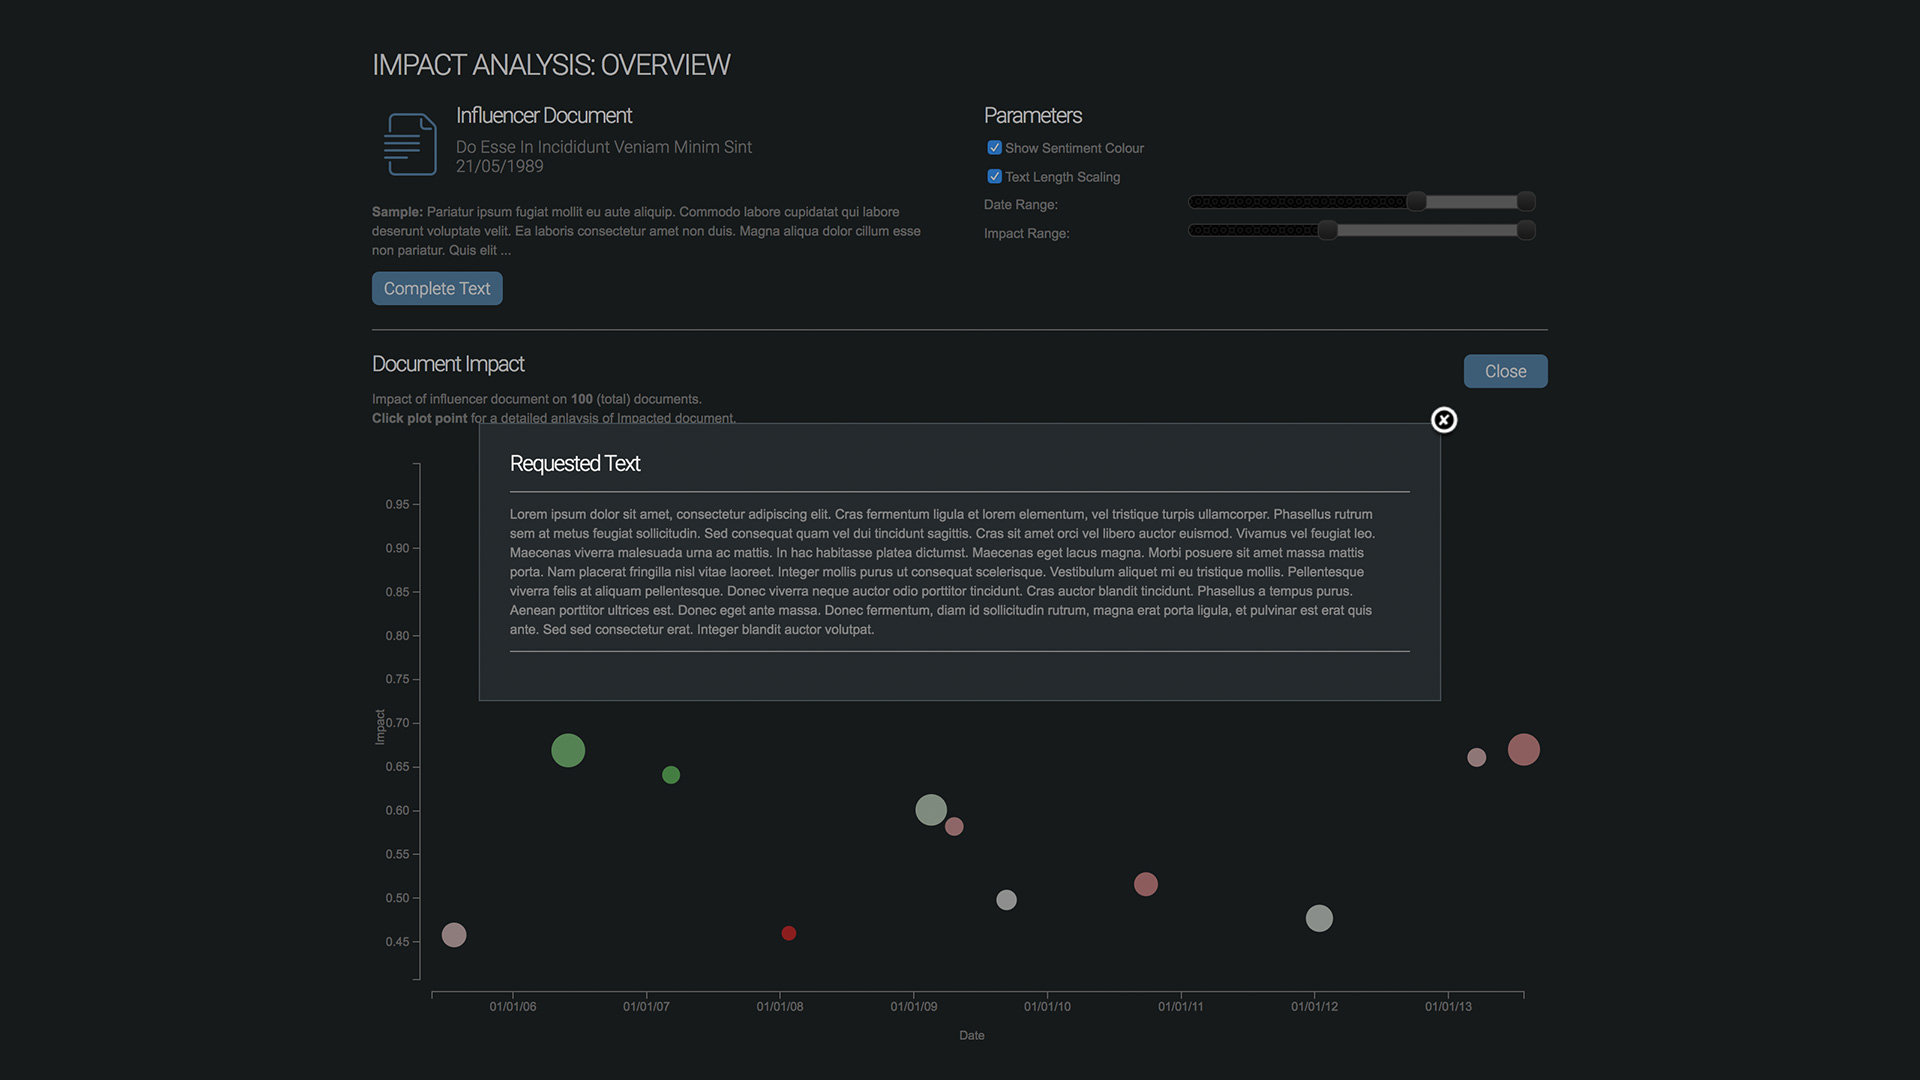
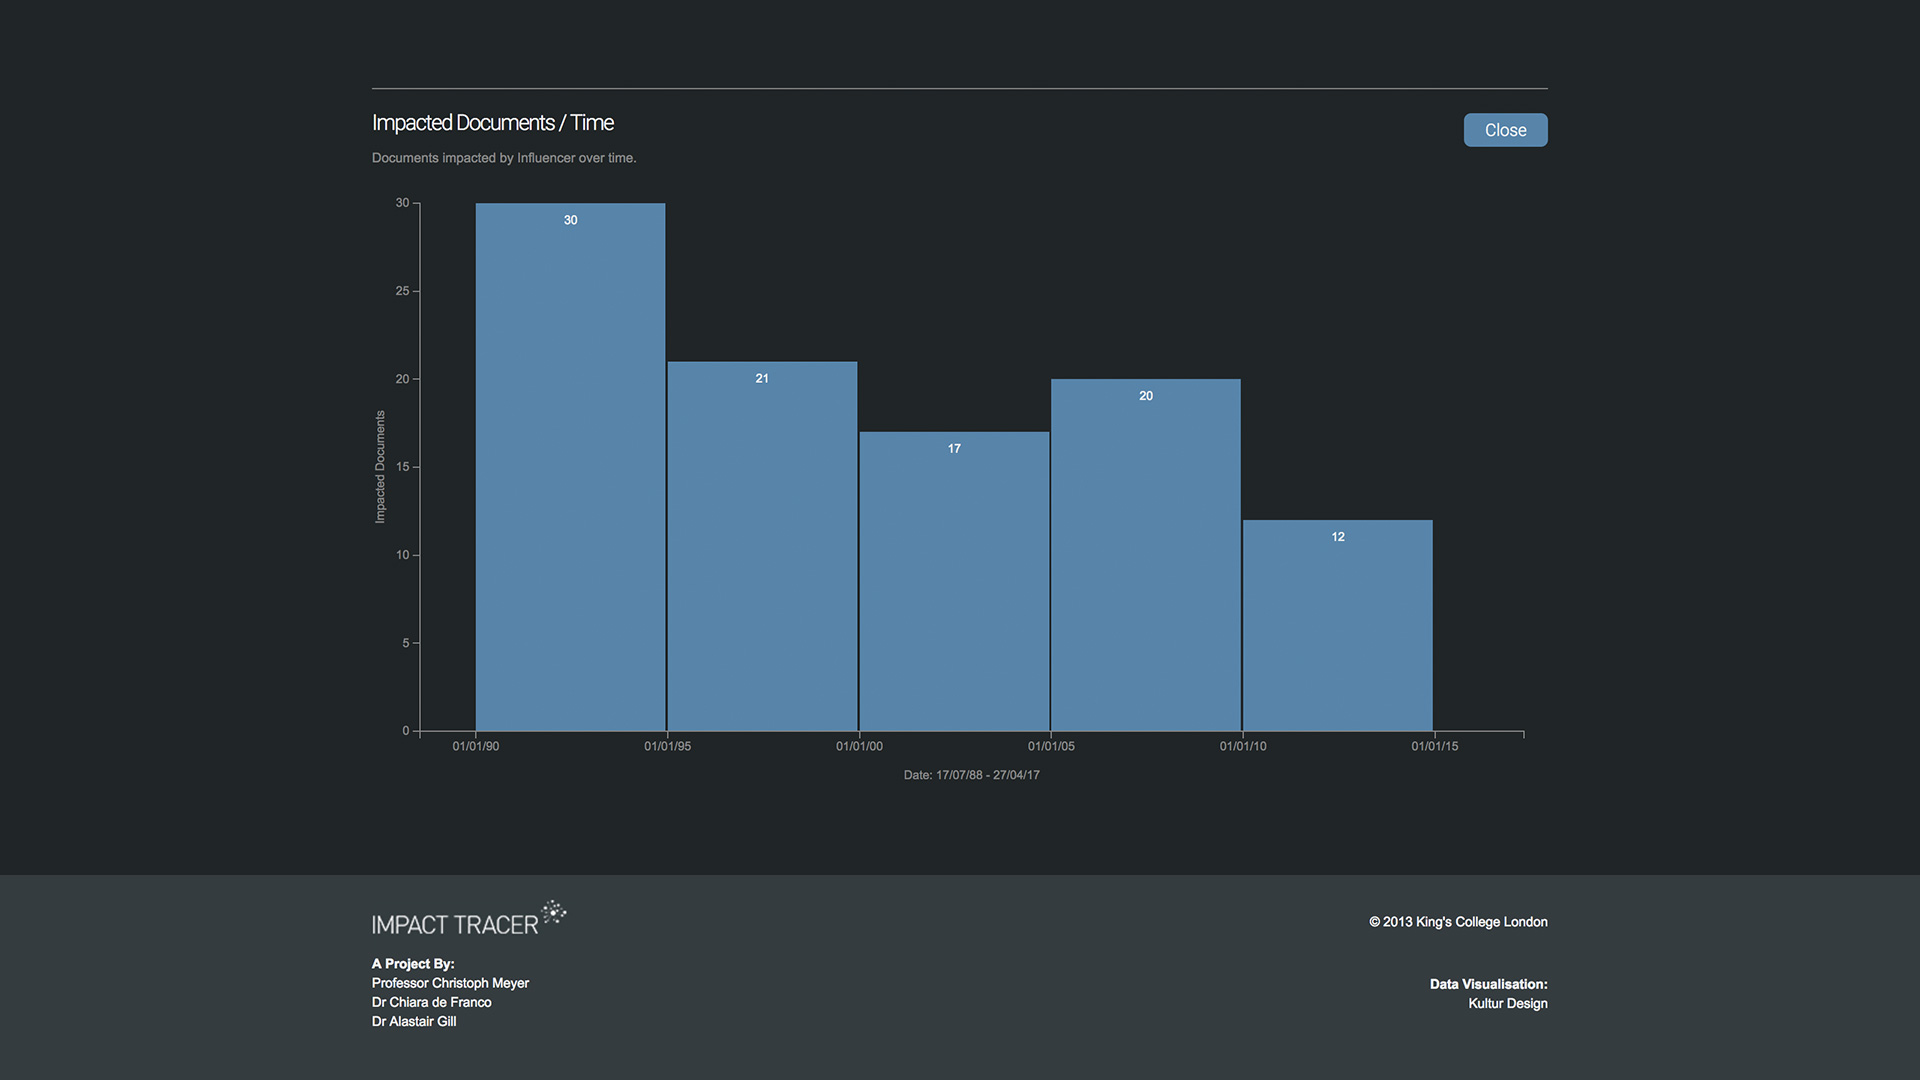
We helped them design a flexible visualisation system that could display the results across a wider range of documents and time scales.
The visualisation (mock ups below) show how one "Influencer" document, impacted a range of subsequent documents. Each point in the scatter plot is a document over time. It's y position shows "level" of impact, colour shows positive/negative sentiment and point size shows amount of text that has been referenced from the original.