London Air Data
A project to visualise the rise & fall of Nitrogen Dioxide levels across London over 1 year
- Client: Self initiated
- Links:
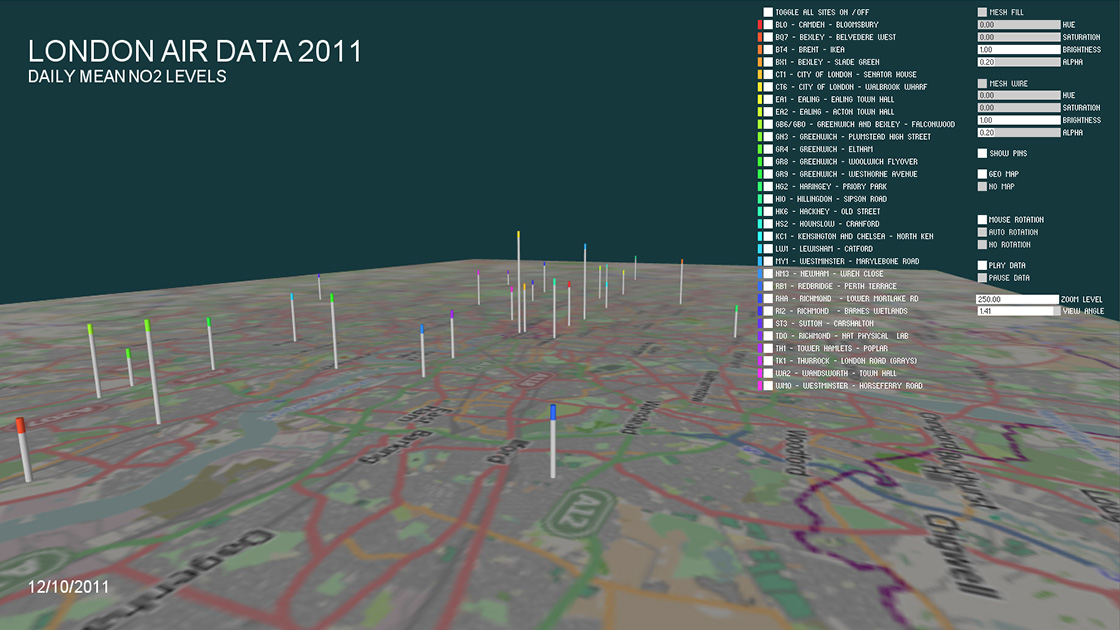
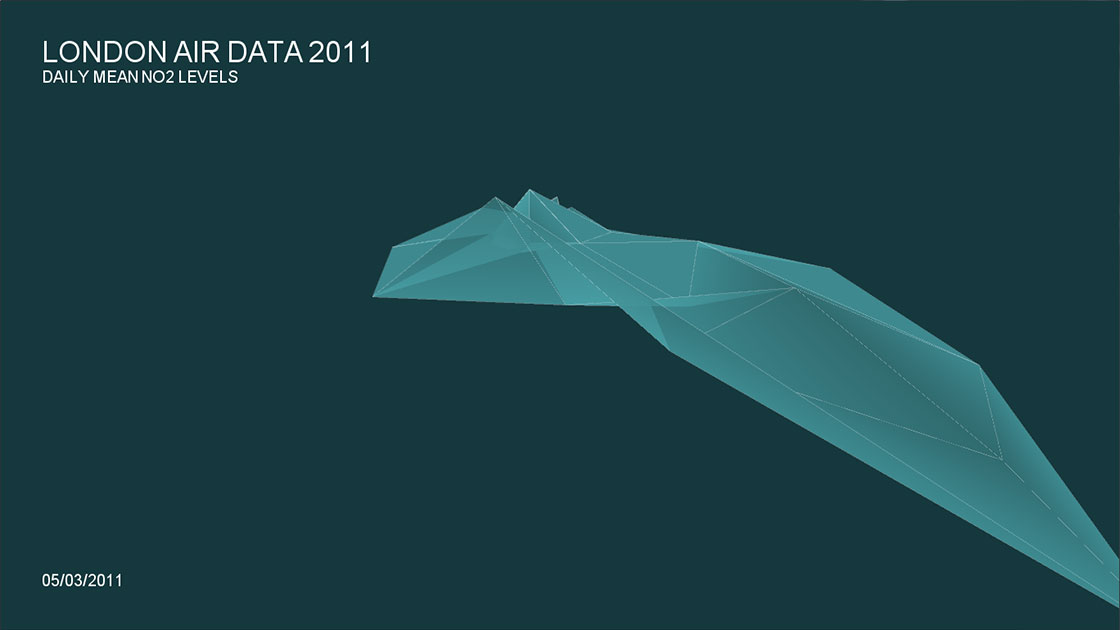
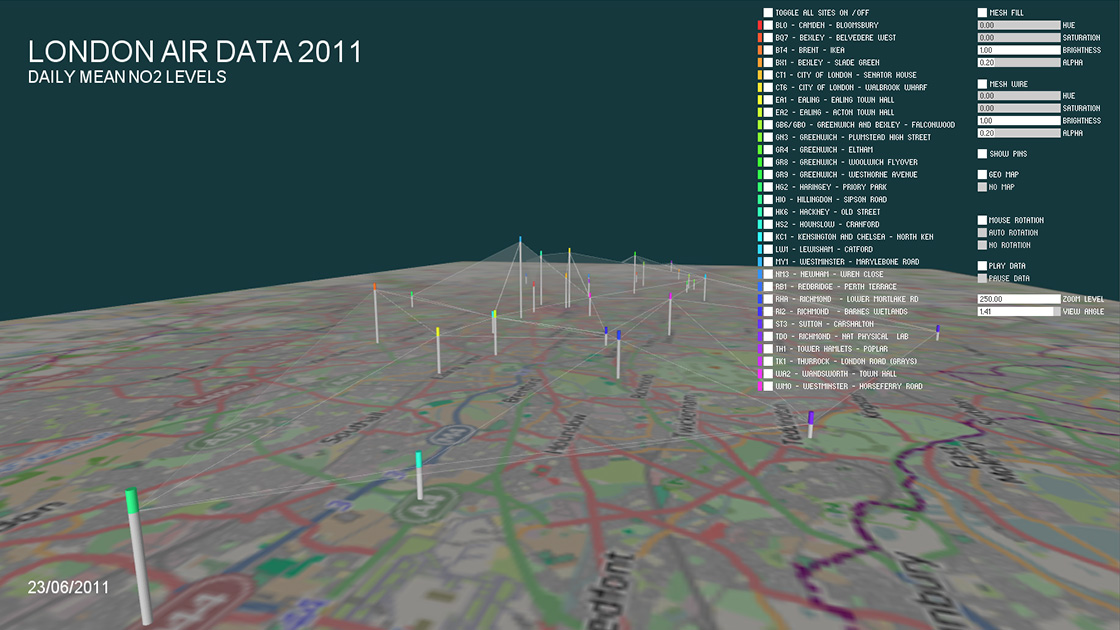
A Processing project to visualise the rise & fall of NO2 levels over London during 2011, using the Kings College air quality data.
We used Openstreetmap.org to generate the map & latitude / longitude area and the University of London's giCentre Utilities for map projections.
Toxiclibs was used for the Vornoi mesh & 3D and ControlP5 for the GUI.